Data Science is getting very popular and many people are trying to jump into the bandwagon, and this is GREAT. But many assume that data science, machine learning, plug any other buzzword here, is to plug data to some Sckit-Learn libraries. Here is what the actual job is.
To bring you into context, the following is happening after the data was collected. Don’t get me wrong, I don’t think it should be considered a simple step, but I would like to focus on data pre-processing and normalization.
The Problem
If you followed my blogs, you probably realized that I work a lot in the Machine 2 Machine field. Recently at work I was trying to cluster machine together based on their behaviour, aka their data consumption.
These features report the usage download and upload of specific categories of services, e.g. Social Media, Audio, etc. For this, let’s assume that we are looking at a counter that looks at how much connection was established to AWS (Amazon Web Services).
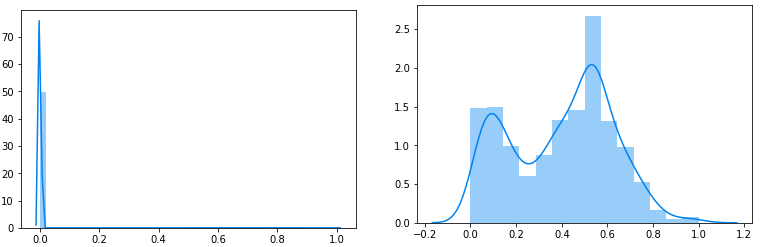
If we take the data as is and decide to pull clusters out of it, we get something like this:
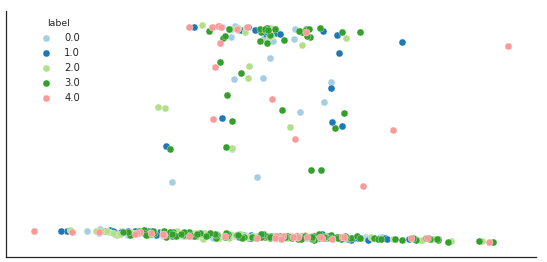
Note, this an LDA 2 axis representation of the data. The LDA as a ± 90% representation factor. Even if it’s not perfect the clustering is close to useless. At this point, some I suggest using this or that algorithm and to tune the hyper parameters and this is exactly the worst idea.
The Infamous Data
Now, let’s work a bit. What does the data look like. Advise you should spend a lot of time before typing some from sklearn.cluster import KMeans. We will look at one specific feature for this example but, keep in mind that most of them were similar.
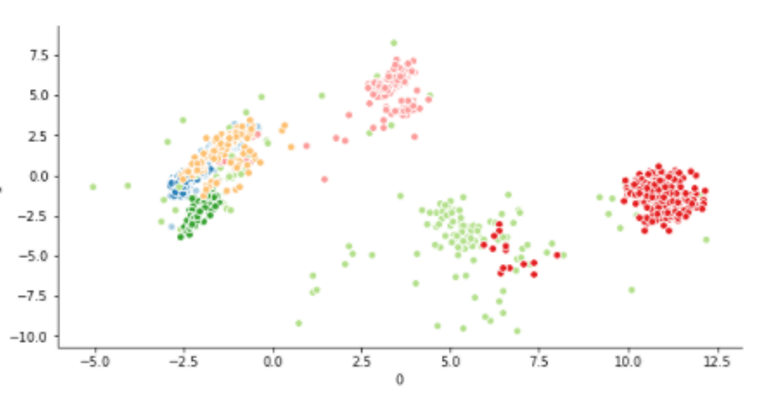
Here is the AWS Counter (Not really but we will pretend).
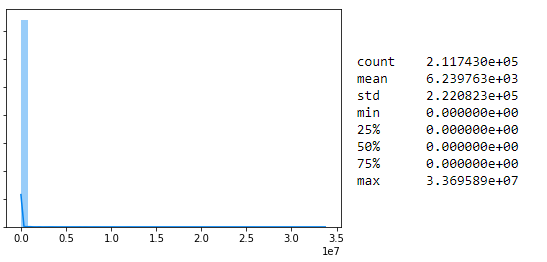 All the data seems to be 0, but if you look in detail, there is value going up to 3e+7. How on earth do you expect to create any meaningful distance with this. Even if you scale it between 0 and 1 most of the data will be between 0 and 0.0000005 or something like this, hence the distance won’t get any better.
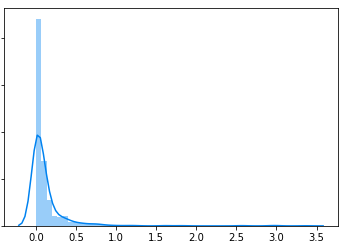
If we look at all the non-zero data, we have something more interesting:
Data processing
This start to look like a LogNormal distribution. Now how can we normalize it. At least a bit. So a colleague of mine, Tanguy had a very clever idea on how to convert that lognormal Distribution. The Box Cox transform. This transform tries to “normalize” as much as possible a different distribution including LogNormal.
This transform tries to minimize the lamda value in this formula (Picture from Wikipedia) :
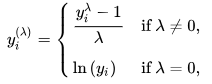
In our case, there is so much zeros that lamda would be lower to something like this: (Note: You need to get only positive value so 1 was added to all values)
In this picture you can see the small bump at around 9 and it contains most of the non-zero data. At this point we already have something better, order of magnitude better in terms of distances but still it could be improved.
Let’s bring back the context of this data again. We are trying to categorized machine behaviour. In the world of machine to machine there is a lot of information hidden in this. The machine CAN use AWS. It sounds funny but it’s very important here. These machines are usually programmed to do a very specific task, e.g. Report weather, show adds, etc. Their task is usually hard-coded and they don’t randomly start going on Facebook or something. Just the fact that they can use a service (like AWS) is a lot of information. So my plan was set, I will leave the zeros at zeros and then give the range 0.5 to 1 for the rest of this data. Now how to express the rest of the data… Box Cox transform. I will do the transform on the only non-zero devices.
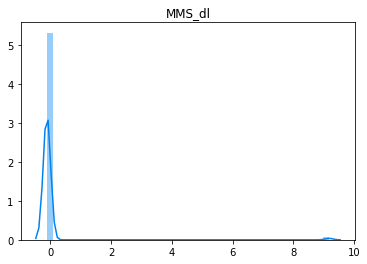
So here is what it looks. On the left you can see all the data transformed like explained in a 0 – 1 space. On the right, you have a zoomed graphic of the section between 0.5 and 1.
 Even if the left graph does not seem that better, I can assure you that for the algorithm it’s a world of differences.
Result
So, after pre-processing the data, we ran the clustering algorithm on it, and without any customization we got that results.
Conclusion
I find people are a bit “trigger happy” on the algorithms and jump too quickly to the model building. Some say that you don’t even have to understand the math behind and I disagree, you need to understand at least the fundamental of an algo. At lease enough to understand how to prepare the data for it. As examples in K-Means it’s all about the distance between point, and when you have this type of range (10e7) you cannot expect the algo to find subtitle patterns, it will be blinded by the range.
So please, look at your data again and again. To the point you feel you can separate it by hand, then let fancy algorithms to the rest of the work.